
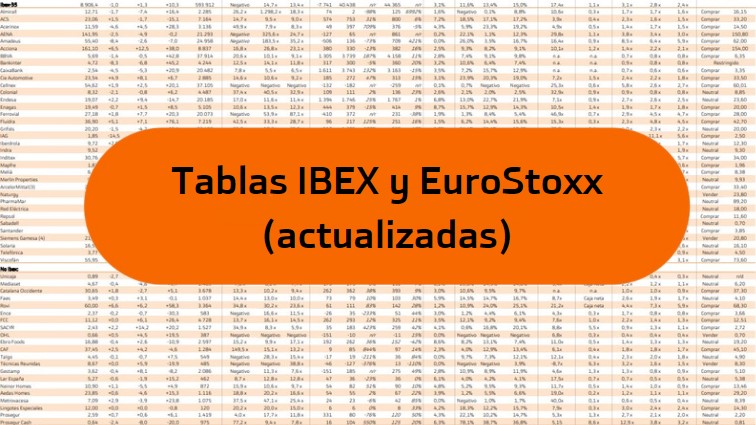
You can download the ratios by clicking on the photo above or from this link: Updated ratios of the Ibex and the Eurostoxx.
Ratios of EuroStoxx 50 companies
EuroStoxx profitability
- The first block shows the profitability of companies over the last year.
- Next to this data is the market capitalization or the total value of the company according to its stock market listing .
PER EuroStoxx companies
- In the second block of columns we find the PER (Price earnings ratio). The PER is the number of times that a company's market capitalization is included in its expected profit . So, for example, if a company is worth 500 million and is expected to earn 50 million annually, its PER will be the result of dividing the first value by the second, that is, 10. Companies with a lower PER are said to be cheap and those with a higher PER are said to be expensive.
EuroStoxx net profit
- Attributable net profit : shows a company's estimated profit for the current financial year.
EuroStoxx companies profitability
- Dividend yield and next dividend : This block shows the estimated dividend yield for 2020-2021 based on the dividends expected to be paid in the year as well as the date of the next expected dividend.
- ROE (Return on Equity): measures financial profitability and relates the economic benefit obtained with the resources . It is a measure of how a company invests funds to generate income and is usually expressed as a percentage that measures net profit divided by equity . In a simple example, if we invest 1 million euros in a business and it returns 100,000 euros in profit, the ROE would be 10%.
Other EuroStoxx 50 ratios
- D/FFPP ( Debt /equity): measures the level of debt that a company has in relation to its equity. The lower the debt, the better , as it indicates that the company has little debt.
- P /B/V (Price/ Book Value ): If this value is 1, it means that the capitalization matches its accounting valuation . According to this, a company with a P/B ratio of less than 1 indicates a theoretical undervaluation, since its price would be below its accounting value. On the other hand, ratios higher than 1 indicate an overvaluation. In short, the lower this ratio is, the cheaper a company is according to this criterion . It must be taken into account that the accounting values of a company depend on variable accounting criteria and asset valuation , which have very little to do with the profitability of the company.